

Your machines generate data.
Your customers want insights.
We help OEMs turn machine data into scalable analytics — consistent dashboards, standardized KPIs, and reporting that works across your entire installed base without a custom project for every customer.
The data is there. The insights aren’t.
Most OEMs have solved connectivity. Machines are online, data is flowing. But every customer still gets a different dashboard, built by hand, maintained separately, and impossible to scale.
analytics starts as a service project and never becomes a product. Each new customer resets the clock.
What changes when analytics scales properly
-
One KPI model that works for every customer site
-
New installations go live without rebuilding the dashboard
-
Your service team reads the same numbers as your customer
-
You can compare performance across your fleet
-
Analytics becomes an asset, not a maintenance burden
Which challenge fits your situation?
Most OEMs start with one. Pick the one closest to your current pain.
Your customers ask for reports you build manually
You’re exporting data by hand, sending Excel files, or building one-off Power BI dashboards per customer. It works — but it doesn’t scale.
Your service team diagnoses problems on-site instead of remotely
Engineers travel to machines they could have diagnosed from a dashboard. Alarm history isn’t structured. Patterns aren’t visible across installations.
You can’t compare performance across your installed base
You have hundreds of machines in the field but no way to see which configurations outperform others, or where downtime clusters across your fleet.
A fleet dashboard that works for every machine, every customer
Built in Power BI on a clean data foundation. Standardized KPIs across all your installations, with room for customer-specific views where needed.
-
Availability and downtime tracked consistently across sites
-
New customer onboarded in minutes, not weeks
-
Customers access their own view — no manual reporting needed
-
Open data layer — no lock-in to a single BI tool
We start from the decision, not the dashboard
Most analytics projects fail because they start with tools. We start with what your team and customers actually need to decide — and work backwards from there.
-
Start by picking a BI tool or platform
-
Build a custom dashboard for each customer
-
Treat every OEM like a blank-slate IT project
-
Lock you into proprietary tools or data formats
-
Define the decisions first, then the data model
-
Build one reusable layer that covers your full fleet
-
Respect differences between customers and machine types
-
Deliver an open foundation you own and can extend
Not sure if this fits your situation? That’s exactly what the Quick Scan is for.
Request a Quick Scanreduction in manual reporting
to onboard a new site
machines connected
How TMI improved efficiency with StriData’s analytics foundation
TMI operates 1,500+ machines across 40 countries. Instead of building dashboards per customer, they now use one standardized analytics layer across their full installed base.
“We are very grateful for the partnership with StriData and their willingness to ensure the customer’s needs are met.”
TMI Automation Programme Manager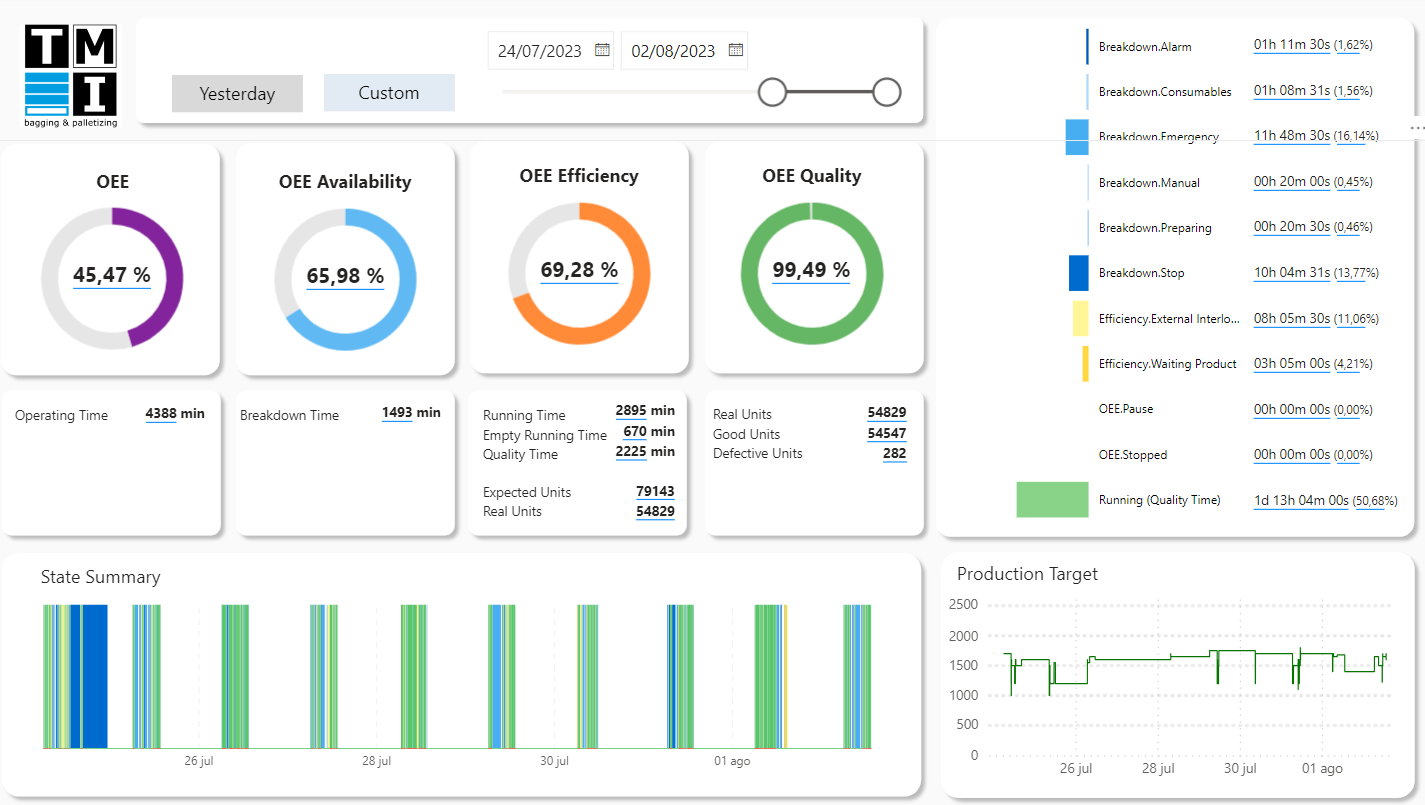

Start with clarity for your machines
If you're a machine builder dealing with growing requests for data, reporting, or customer dashboards that don’t scale, we’re happy to explore where structure can make the biggest difference.
StriData supports analytics for 1,500+ machines, building one reusable data layer that powers both service teams and customer-facing reporting.
Martijn van Dijk
Founder & Data Engineer
Scalable analytics for machine builders
Your customers want insight, not raw machine data.
We help you define what to measure and scale analytics across customers, without turning analytics into a custom software product.
- Machines generate more data than ever
- Connectivity is largely solved
- Customers want insight, not raw data
- Analytics starts as a project add-on
- Dashboards differ per customer
What we see:
The reality for modern OEMs regarding data
Most machine builders we speak with are facing the same paradox: their machiness generate terabytes of data, yet they struggle to extract consistent value from it. Over time, this leads to fragmented dashboards and unclear KPI definitions.
- Clear agreement on what to measure
- KPIs tied to service and operational decisions
- Small, standardized core KPI set
- Room for customer-specific extensions
- Open data foundations, no tool lock-in
What’s required:
The foundations of scalable OEM analytics
Scalable OEM analytics is not achieved by adding more dashboards or tools. It starts with establishing a shared foundation that allows insights to be reused, compared, and extended across customers. If you want analytics to scale beyond individual projects, these fundamentals must be in place.
Roadmap to scalable OEM Analytics
A practical path from fragmented dashboards to repeatable insights, without turning analytics into a custom project per customer.
1. Clarify decisions & scope
Before collecting more data or building dashboards, align on the metrics that truly matter across customers.
2. Define a core KPI model
Agree on a small KPI set and definitions that work across most customers and machine fleet.
3. Build the data foundation
Make machine data accesible, structured, and usable long-term, independent of dashboards or platforms.
4. Deliver decision-ready dashboards
Build dashboards as an outcome of the KPI model: consistent, comparable and reusable across customers.
5. Extend where it adds value
Allow customer-specific extensions and selective AI solutions without breaking core KPI logic or comparability.
KPIs that OEMs can standardize responsibly
Not every KPI should be standardized and not every machine needs full OEE. Below are examples of KPIs that often make sense for OEMs when measurement foundations are in place.
Core KPIs (often Phase 1):
These KPIs focus on machine behavior and availability, making them suitable for standardization across customers.
Availability
Shows when a machine is able to run versus when it is not. Availability is usually the first KPI that can be defined and standardized across customers.
Downtime duration & causes
Explains how long machines are unavailable and why. Structured downtime causes enable consistent analysis and meaningful prioritization.
Machine Utilization Rate (MUR)
Indicates how often machines are actually used relative to their potential. Utilization adds context to both performance and capacity discussions.
Extended KPIs (context-dependent):
These KPIs add value once core definitions are stable and consistent.
Overall Equipment Effectiveness (OEE)
Combines availability, performance, and quality into a single metric. OEE becomes valuable once loss definitions and measurement logic are agreed.
Mean Time Between Failures (MTBF)
Measures the average time between failures to assess reliability. MTBF is meaningful when failure events are consistently defined and recorded.
Operational Machine Energy Consumption
Tracks energy usage in relation to runtime, machine states, or output. Energy KPIs gain value when sufficient, reliable operational context is available across machines and time.
What this looks like in practice:
Strategic Fleet Dashboard
- Standarized KPI's
- Consistent and comparable
- Focused on availability & downtime
How StriData works
Most digital iniatives fail not because of technology, but because organizations move too quickly to solutions. Our approach is deliberatly structured to create clarity first, only then technology is apllied where it adds value.
1. Business Strategy First
Align goals, service responsibilities, and customer expectations before defining KPIs.
2. Data infrastructure
Design a clear, scalable data structure that organizes machine data for consistent, reusable analytics.
3. Decision-ready insights
Only then build dashboards and analytics that support service and operational decisions throughout the organization.
What makes this approach different:
We don't:
- Start with dashboards or reports
- Apply generic KPI or OEE templates
- Treat analytics as a one-off project
- Lock OEMs into tools or platforms
We do:
- Start from decisions and responsibilities
- Standardize only what truly scales
- Respect machine and customer differences
- Build on open, reusable data foundations
How StriData works
Most digital iniatives fail not because of technology, but because organizations move too quickly to solotuions. Our approach is deliberatly structured to create clarity first, only then we technoloy is apllied where it adds value.
“We are very grateful for the partnership with StriData and their willingness to ensure the customer’s needs.”
Oriol Miarnau, Automation Engineer @ TMI
Use Case
How TMI improved efficiency with StriData's analytics tool.
After implementing StriData's machine analytics tool, TMI were able to improve their overall equipment effectiveness (OEE), reduce downtime significantly and share machine data instantly with their customers.
Trusted by
Resources
Insights for machine builders
Business Intelligence tools are widely used in industrial environments, but they are often discussed as if one tool could cover every use case. In practice, industrial data brings very different requirements depending on whether the goal is monitoring, analysis, or decision support. This article gives an overview of commonly used BI and visualization tools in […]
IXON Cloud welcomes StriData as a TechnologyAlliance Partner to further support advanced machine analytics. Both parties see a rising demand for integrations with AWS, Azure and BI-tools. StriData solutions combine the possibilities of IXON Cloud with these cloud computing services to enable IXON customers to combine live and historical data analytics from multiple sources and […]
How StriData works
Most digital iniatives fail not because of technology, but because organizations move too quickly to solotuions. Our approach is deliberatly structured to create clarity first, only then we technoloy is apllied where it adds value.